Benchmarking UUID v4 vs v7 primary keys in Postgres

In light of the recent news of native UUID v7 GUID support coming to .NET 9, I have been deep-diving into UUID specification, as well as the pros and cons of using UUID v7 as database table primary keys.
There are already plenty of awesome deeply technical articles on this topic, showcasing the difference in performance. However, I wanted to see the specific impact of moving from UUID v4 to UUID v7 GUIDs as primary keys for one of my projects I have been working on lately - webpage_change_monitor: a self-hosted web application for monitoring HTML changes in web pages.
A quick disclaimer before we begin - I am not a Postgres expert, or anything - just sharing my journey while trying to learn something new.
Setup
To make my tests easier I have composed a simple console application, where I set up the database access infrastructure to be almost exactly the way it is in my project, apart from minor simplifications. Here is the setup:
- .NET 8 Console application.
- EF Core + Npgsql.EntityFrameworkCore.PostgreSQL adapter.
- UUIDNext.
- Postgres 16.
Since Postgres 16 does not natively support UUID v7 (with support possibly coming to Postgres 17) I had to generate the primary keys externally in my C# code using UUIDNext: a fast and modern .NET library that generates database friendly UUIDs / GUIDs, including v7.
Setting goals
Target benchmark metrics
- Sequential write performance.
- Table and index size.
- Manual table clustering performance.
Reasons to migrate to UUIDv7 (at least, in theory)
- Improved write performance: my application to the database communication pattern is hugely write-dominated; UUID v7 offers better index locality, meaning faster B-tree operation, fewer partially empty leafs, less page space needed, fewer dirty pages, etc..
- Smaller table and index size: due to the same reasons, described in the previous list item.
- Improved lookup performance: my application most often reads just the newest data; increased index locality and a leaner more balanced B-tree should help with faster lookups.
The benchmark begins
Setup database
Find scripts here.
1
2
3
4
5
6
7
8
9
10
11
12
13
14
15
16
17
18
19
20
21
22
23
24
25
26
27
28
29
30
31
32
33
34
35
36
37
38
39
40
41
42
43
44
45
46
47
48
-- [optional] create a schema
start transaction;

create schema if not exists monitor;

commit;

-- create a table for UUIDv4 primary keys
start transaction;

create table if not exists monitor.targets_v4 (
    id uuid primary key,
    resource_id uuid,
    display_name text not null,
    description text,
    url text not null,
    cron_schedule text not null,
    change_type text not null,
    html_tag text not null,
    selector_type text not null,
    selector_value text not null,
    expected_value text,
    created_at timestamp not null,
    updated_at timestamp
);

commit;

-- create a table for UUIDv7 primary keys
start transaction;

create table if not exists monitor.targets_v7 (
    id uuid primary key,
    resource_id uuid,
    display_name text not null,
    description text,
    url text not null,
    cron_schedule text not null,
    change_type text not null,
    html_tag text not null,
    selector_type text not null,
    selector_value text not null,
    expected_value text,
    created_at timestamp not null,
    updated_at timestamp
);

commit;
Here I went with B-tree for primary key indexes (default) even though better performance can be achieved with different data structures, like BRIN (not so simple, comes with some limitations).
Run the code
1
2
3
4
5
6
7
8
9
10
11
12
13
14
15
16
17
18
19
20
21
22
23
24
25
26
27
28
29
30
31
32
33
34
35
36
37
38
39
40
41
42
43
44
45
46
47
48
49
50
51
52
53
54
...

const int batchCount = 10;
const int targetPerBatchCount = 1000;

var v4Ticks = new List<long>();
var v7Ticks = new List<long>();

for (int i = 0; i <= batchCount ; i++)
{
    // insert uuid v4 entries

    var swV4 = Stopwatch.StartNew();

    for (int j = 1; j <= targetPerBatchCount; j++)
    {
        var target = CreateTargetV4(Guid.NewGuid());

        _context.TargetsV4.Add(target);
        await _context.SaveChangesAsync();
    }

    swV4.Stop();

    // here we disregard the results of the first 'warmup' batch
    if (i != 0)
    {
        v4Ticks.Add(swV4.ElapsedMilliseconds);
        Console.WriteLine($"UUID v4 batch {i}/{batchCount} completed.");
    }

    // insert uuid v7 entries

    var swV7 = Stopwatch.StartNew();

    for (int j = 1; j <= targetPerBatchCount; j++)
    {
        var target = CreateTargetV7(Uuid.NewDatabaseFriendly(Database.PostgreSql));

        _context.TargetsV7.Add(target);
        await _context.SaveChangesAsync();
    }

    swV7.Stop();

    if (i != 0)
    {
        v7Ticks.Add(swV7.ElapsedMilliseconds);
        Console.WriteLine($"UUID v7 batch {i}/{batchCount} completed.");
    }
}

...
Nothing fancy, just running 11000 sequential single writes per UUID type in 11 batches, so that we have some more atomized metrics to work with. Notice that we are excluding the first batches from the execution time metric collection, since I have noticed that the results do not represent the actual performance (x5 - x10 times slower than all the following batches), probably due to some kind of EF Core-related overhead costs.
Measure table and index size
1
2
3
4
5
6
7
8
9
select
    relname as "table",
    indexrelname as "index",
    pg_size_pretty(pg_relation_size(relid)) "table size",
    pg_size_pretty(pg_relation_size(indexrelid)) "index size"
from
    pg_stat_all_indexes
where
    relname not like 'pg%';
Measure table clustering execution time
1
2
CLUSTER monitor.targets_v4 USING targets_v4_pkey;
CLUSTER monitor.targets_v7 USING targets_v7_pkey;
Results
Here is what I ended up with. Notice, that results for Run 3 and 4 are identical to 1 and 2 in terms of batch and write counts, however, I swapped the write order to make sure the benchmark is not biased in this way, in case there are some kind of weird overheads or other shenanigans related to the order of operations.
First UUID v4, then UUID v7, Run 1
- Batches: 11.
- Writes per batch: 1000x2.
- Total writes: 22000.
Batch execution time:
| # | UUID v4 | UUID v7 |
|---|---|---|
| 2 | 8992 | 10768 |
| 3 | 11013 | 11836 |
| 4 | 11999 | 12619 |
| 5 | 13858 | 14958 |
| 6 | 15913 | 16698 |
| 7 | 17600 | 18567 |
| 8 | 19124 | 20340 |
| 9 | 21267 | 22570 |
| 10 | 23628 | 24423 |
| 11 | 25235 | 26616 |
| Avg. | 16862.9 | 17939.5 |
Table size metrics:
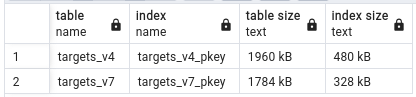
Table clustering execution time:
- targets_v4_pkey: 142 msec.
- targets_v7_pkey: 127 msec.
First UUID v4, then UUID v7, Run 2
- Batches: 11.
- Writes per batch: 1000x2.
- Total writes: 22000.
Batch execution time:
| # | UUID v4 | UUID v7 |
|---|---|---|
| 2 | 8723 | 10016 |
| 3 | 10782 | 12741 |
| 4 | 11843 | 14752 |
| 5 | 15459 | 16622 |
| 6 | 16732 | 19233 |
| 7 | 21179 | 21089 |
| 8 | 23107 | 20283 |
| 9 | 21959 | 25448 |
| 10 | 26280 | 25159 |
| 11 | 25128 | 27723 |
| Avg. | 18119.2 | 19306.6 |
Table size metrics:
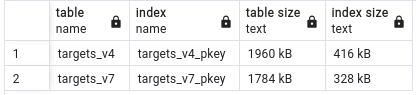
Table clustering execution time:
- targets_v4_pkey: 121 msec.
- targets_v7_pkey: 96 msec.
First UUID v4, then UUID v7, Run 3
- Batches: 66.
- Writes per batch: 1000x2.
- Total writes: 132000.
Batch execution time: N/A.
Table size metrics:
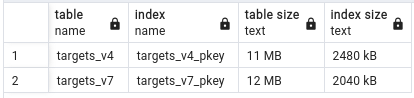
Table clustering execution time:
- targets_v4_pkey: 227 msec.
- targets_v7_pkey: 212 msec.
I did not compile an execution time table for for this run since I ran 6 Docker containers in parallel to speed up the benchmark. However, based on the logs the results for individual containers are very similar to Run 1 and Run 2.
First UUID v7, then UUID v4, Run 1
- Batches: 11.
- Writes per batch: 1000x2.
- Total writes: 22000.
Batch execution time:
| # | UUID v4 | UUID v7 |
|---|---|---|
| 2 | 11001 | 8733 |
| 3 | 11896 | 10533 |
| 4 | 13152 | 12747 |
| 5 | 15361 | 14393 |
| 6 | 17311 | 16850 |
| 7 | 19217 | 18208 |
| 8 | 21520 | 20115 |
| 9 | 23558 | 22071 |
| 10 | 25842 | 24381 |
| 11 | 27745 | 26825 |
| Avg. | 18660.3 | 17485.6 |
Table size metrics:
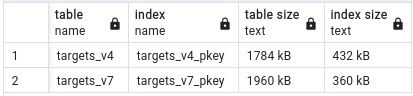
Table clustering execution time:
- targets_v4_pkey: 176 msec.
- targets_v7_pkey: 154 msec.
First UUID v7, then UUID v4, Run 2
- Batches: 11.
- Writes per batch: 1000x2.
- Total writes: 22000.
Batch execution time:
| # | UUID v4 | UUID v7 |
|---|---|---|
| 2 | 10191 | 8620 |
| 3 | 12222 | 11227 |
| 4 | 13521 | 12803 |
| 5 | 15768 | 15072 |
| 6 | 17885 | 17428 |
| 7 | 19179 | 18291 |
| 8 | 21236 | 20215 |
| 9 | 23324 | 23388 |
| 10 | 26530 | 24686 |
| 11 | 28273 | 26581 |
| Avg. | 18812.9 | 17831.1 |
Table size metrics:
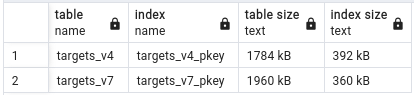
Table clustering execution time:
- targets_v4_pkey: 104 msec.
- targets_v7_pkey: 98 msec.
Conclusion
As expected, when it comes to write performance, there is no meaningful difference. It fluctuates around 5.2 - 6.5 % in favor of both the UUID versions. The values do increase batch by batch, which makes sense as the B-tree grows bigger and does a lot of heavy lifting, in the beginning, to try and remain balanced. Closed to the last couple of batches the difference is not as drastic, which makes sense given that B-tree inserts are O(log n).
However, where there is difference is when it comes to table and index sizes. UUID v7 tables are on average ~ 8 - 10 % smaller when indexes take up around 21 - 46% less space. What else is interesting is that UUID v7 indexes are very repeatable in size, while UUID v4 varies by about 10 to 15 % between runs. Better index locality for the win!
When it comes to table clustering performance here, as expected, UUID v7 also allows for around 20% faster operations on average.
Said all that, it seems like there are noticeable benefits to using UUID v7 over UUID v4 as primary keys in Postgres with EF Core, just not as crazy as for the other database engines that do support clustered indexes, like MySQL or MS SQL Server.
As usual, I hope you found this blog entry useful. Feel free to reach out to me in case of any questions, to share your feedback, findings, or ideas.
References and further reading
- Maybe We Don’t Need UUIDv7 After All by Luciano
- UUID in PostgreSQL by Franck Pachot
- PostgreSQL and UUID as primary key by Maciej Walkowiak
- Goodbye integers. Hello UUIDv7! by Gordon Chan
- Postgres: Benchmark UUIDv4 vs UUIDv7 Primary Keys by Michael Blum
- Why UUID7 is better than UUID4 as clustered index in RDBMS by RimonTawadrous
- The best UUID type for a database Primary Key by Vlad Mihalcea